Posts in 2 Minute Tutorials

Setting up Jenkins on Kubernetes Engine on GCP

Activate Cloud Shell

Cloud Shell is a virtual machine that is loaded with development tools. It offers a persistent 5GB home directory and runs on the Google Cloud. Cloud Shell provides command-line access to your Google Cloud resources.

  1. Click Activate Cloud Shell Activate Cloud Shell icon at the top of the Google Cloud console.

When connected, you are already authenticated, and the project is set to your PROJECT_ID. The output contains a line that declares the PROJECT_ID for this session: Your Cloud Platform project in this session is set to YOUR_PROJECT_ID

gcloud is the command-line tool for Google Cloud. It comes pre-installed on Cloud Shell and supports tab completion.

  1. (Optional) You can list the active account name with this command:
gcloud auth list
  1. Click Authorize.
  2. (Optional) You can list the project ID with this command:
gcloud config list project
Output:[core] project = <project_ID>

Task 1. Prepare the environment

First, you’ll prepare your deployment environment and download a sample application.

  1. Set the default Compute Engine zone to <filled in at lab start>:
gcloud config set compute/zone
  1. Clone the sample code:
git clone https://github.com/GoogleCloudPlatform/continuous-deployment-on-kubernetes.git
  1. Navigate to the sample code directory:
cd continuous-deployment-on-kubernetes

Creating a Kubernetes cluster

Now you’ll use the Kubernetes Engine to create and manage your Kubernetes cluster.

  1. Next, provision a Kubernetes cluster using Kubernetes Engine. This step can take several minutes to complete:
gcloud container clusters create jenkins-cd \ --num-nodes 2 \ --scopes "https://www.googleapis.com/auth/projecthosting,cloud-platform"

The extra scopes enable Jenkins to access Cloud Source Repositories and Google Container Registry.

  1. Confirm that your cluster is running:
gcloud container clusters list

Example Output:

Look for RUNNING in the STATUS column:NAME LOCATION MASTER_VERSION MASTER_IP MACHINE_TYPE NODE_VERSION NUM_NODES STATUS jenkins-cd 1.9.7-gke.3 35.237.126.84 e2-medium 1.9.7-gke.3 2 RUNNING

  1. Get the credentials for your cluster. Kubernetes Engine uses these credentials to access your newly provisioned cluster.
gcloud container clusters get-credentials jenkins-cd
  1. Confirm that you can connect to your cluster:
kubectl cluster-info

Example output: If the cluster is running, the URLs of where your Kubernetes components are accessible display:

Kubernetes master is running at https://130.211.178.38 GLBCDefaultBackend is running at https://130.211.178.38/api/v1/proxy/namespaces/kube-system/services/default-http-backendHeapster is running at https://130.211.178.38/api/v1/proxy/namespaces/kube-system/services/heapster KubeDNS is running at https://130.211.178.38/api/v1/proxy/namespaces/kube-system/services/kube-dns kubernetes-dashboard is running at https://130.211.178.38/api/v1/proxy/namespaces/kube-system/services/kubernetes-dashboard

Task 2. Configure Helm

In this lab, you will use Helm to install Jenkins from the Charts repository. Helm is a package manager that makes it easy to configure and deploy Kubernetes applications. Your Cloud Shell will already have a recent, stable version of Helm pre-installed.

If curious, you can run helm version in Cloud Shell to check which version you are using and also ensure that Helm is installed.

  1. Add Helm’s jenkins chart repository:
helm repo add jenkins https://charts.jenkins.io
  1. Update the repo to ensure you get the latest list of charts:
helm repo update

Task 3. Configure and install Jenkins

You will use a custom values file to add the Google Cloud-specific plugin necessary to use service account credentials to reach your Cloud Source Repository.

  1. Use the Helm CLI to deploy the chart with your configuration set:
helm upgrade --install -f jenkins/values.yaml myjenkins jenkins/jenkins
  1. Once that command completes ensure the Jenkins pod goes to the Running state and the container is in the READY state. This may take about 2 minutes:
kubectl get pods

Example output: NAME READY STATUS RESTARTS AGE myjenkins-0 2/2 Running 0 1m

  1. Run the following command to setup port forwarding to the Jenkins UI from the Cloud Shell:
echo http://127.0.0.1:8080 kubectl --namespace default port-forward svc/myjenkins 8080:8080 >> /dev/null &
  1. Now, check that the Jenkins Service was created properly:
kubectl get svc

Example output: NAME CLUSTER-IP EXTERNAL-IP PORT(S) AGE myjenkins 10.35.249.67 8080/TCP 3h myjenkins-agent 10.35.248.1 50000/TCP 3h kubernetes 10.35.240.1 443/TCP 9h

We are using the Kubernetes Plugin so that our builder nodes will be automatically launched as necessary when the Jenkins master requests them. Upon completion of their work, they will automatically be turned down and their resources added back to the cluster’s resource pool.

Notice that this service exposes ports 8080 and 50000 for any pods that match the selector. This will expose the Jenkins web UI and builder/agent registration ports within the Kubernetes cluster.

Additionally, the jenkins-ui service is exposed using a ClusterIP so that it is not accessible from outside the cluster.

Task 4. Connect to Jenkins

  1. The Jenkins chart will automatically create an admin password for you. To retrieve it, run:
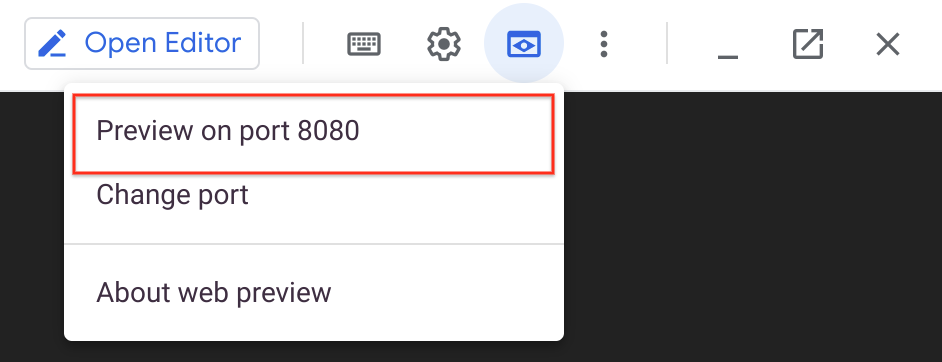
kubectl exec --namespace default -it svc/myjenkins -c jenkins -- /bin/cat /run/secrets/additional/chart-admin-password && echo
  1. To get to the Jenkins user interface, click on the Web Preview button in cloud shell, then click Preview on port 8080:
Expanded Web preview dropdown menu with Preview on port 8080 option highlighted
  1. You should now be able to log in with the username admin and your auto-generated password.

You may also be automatically logged in as well.

You now have Jenkins set up in your Kubernetes cluster!

Welcome Metricbeat from the beats family

Deploy Metricbeat on all your Linux, Windows, and Mac hosts, connect it to Elasticsearch and voila: you get system-level CPU usage, memory, file system, disk IO, and network IO statistics, as well as top-like statistics for every process running on your systems. Metricbeats is an open-source shipping agent used to collect and ship operating system and service metrics to one or more destinations, including Logstash.

Step 1 – Install Metricbeat

deb (Debian/Ubuntu/Mint)

sudo apt-get install apt-transport-https
wget -qO - https://artifacts.elastic.co/GPG-KEY-elasticsearch | sudo apt-key add -
echo 'deb https://artifacts.elastic.co/packages/oss-6.x/apt stable main' | sudo tee /etc/apt/sources.list.d/beats.list
sudo apt-get update && sudo apt-get install metricbeat

rpm (CentOS/RHEL/Fedora)

sudo rpm --import https://artifacts.elastic.co/GPG-KEY-elasticsearch
echo "[elastic-6.x]
name=Elastic repository for 6.x packages
baseurl=https://artifacts.elastic.co/packages/oss-6.x/yum
gpgcheck=1
gpgkey=https://artifacts.elastic.co/GPG-KEY-elasticsearch
enabled=1
autorefresh=1
type=rpm-md" | sudo tee /etc/yum.repos.d/elastic-beats.repo

sudo yum install metricbeat

macOS

curl -L -O https://artifacts.elastic.co/downloads/beats/metricbeat/metricbeat-oss-6.7.1-darwin-x86_64.tar.gz 
tar xzvf metricbeat-oss-6.7.1-darwin-x86_64.tar.gz

Windows

  • Download the Metricbeat Windows zip file from the official downloads page.
  • Extract the contents of the zip file into C:\Program Files.
  • Rename the metricbeat-<version>-windows directory to Metricbeat.
  • Open a PowerShell prompt as an Administrator (right-click the PowerShell icon and select Run As Administrator). If you are running Windows XP, you may need to download and install PowerShell.
  • Run the following commands to install Metricbeat as a Windows service:PS > cd 'C:\Program Files\Metricbeat' PS C:\Program Files\Metricbeat> .\install-service-metricbeat.ps1`   If script execution is disabled on your system, you need to set the execution policy for the current session to allow the script to run. For example: PowerShell.exe -ExecutionPolicy UnRestricted -File .\install-service-metricbeat.ps1

My OS isn’t here! Don’t see your system? Check out the official downloads page for more options (including 32-bit versions).

Step 2 – Locate the configuration file

deb/rpm : /etc/metricbeat/metricbeat.yml
mac/win :<EXTRACTED_ARCHIVE>/metricbeat.yml

Step 3 – Configure the Modules

Setup the data you wish to send us, by editing the modules. Examples of these settings are found in, in the same folder as the configuration file. The system status module is enabled by default to collect metrics about your servers, such as CPU usage, memory usage, network IO metrics, and process statistics:

metricbeat.modules:
- module: system
  metricsets:
    - cpu
    - filesystem
    - memory
    - network
    - process
  enabled: true
  period: 10s
  processes: ['.*']
  cpu_ticks: false

  There’s also a large range of modules to collect metrics see here.

Step 4 – Configure output

We’ll be shipping to Logstash so that we have the option to run filters before the data is indexed.
Comment out the elasticsearch output block.

## Comment out elasticsearch output
#output.elasticsearch:
#  hosts: ["localhost:9200"]

Uncomment and change the logstash output to match below.

output.logstash:
    hosts: ["your-logstash-host:your-port"]
    loadbalance: true
    ssl.enabled: true
Step 5 – Validate configuration

Let’s check the configuration file is syntactically correct.

deb/rpm

sudo metricbeat -e -c /etc/metricbeat/metricbeat.yml

macOS

cd <EXTRACTED_ARCHIVE>
./metricbeat -e -c metricbeat.yml

Windows

cd <EXTRACTED_ARCHIVE>
metricbeat.exe -e -c metricbeat.yml
Step 6 – Start metricbeat

Ok, time to start ingesting data!

deb/rpm

sudo systemctl enable metricbeat
sudo systemctl start metricbeat

mac

./metricbeat

Windows

Start-Service metricbeat

With this, you have installed & configured MetricBeat for your environment. Stay tuned for others from the Beats family and also the ElasticSearch Stack Installation.

vCSA 6.x Upgrade error: “No networks on the host. Cannot proceed with the installation.”

Recently during the vCSA 6.0 to 6.7 upgrade process, I encountered an error while deploying the new vCenter server appliance with an embedded PSC on the vCSA 6.7 installer.

The problem

In my case, I was trying to upgrade vCSA 6.0. If you notice that the network section is empty:

I cannot proceed, because of the error and it shows:

No networks on the host. Cannot proceed with the installation.

The Solution

The configuration on ESXi hosts and VCenter looked OK and obviously, it had port groups created in a standard virtual switch.

So the issue was that I didn’t have “VM Network” port group that is a default port group that is created once you deploy an ESXi host. In my case, it was auto-deployed with different port groups and that one didn’t exist.

Hence, as soon as I created a port group called “VM Network” in the host that I am trying to deploy the vCSA, it worked!

Now, I can see the port group and I was able to continue the installation with success!

I hope this worked for you as well.

How to change root password in Ubuntu Linux

By default, the root user account password is locked in Ubuntu Linux for security reasons. As a result, you can not login using root user or use a command such as ‘su -‘ to become a SuperUser.

You need to use the passwd command to change the password for user accounts on Ubuntu Linux. A typical user can only change the password for his/her account only. A SuperUser (root) can change the password for any user account. Your user account info stored in /etc/passswd and an encrypted password stored in /etc/shadow file.

How to change root password in Ubuntu

The procedure to change the root user password on Ubuntu Linux:

  1. Type the following command to become root user and issue passwd:
    sudo -i
    passwd
  2. OR set a password for root user in a single go:
    sudo passwd root
  3. Test it your root password by typing the following command:
    su –

A note about root password on an Ubuntu server/desktop

Enabling the root account by setting the password is not needed. Almost everything you need to do as SuperUser (root) of an Ubuntu server can be done using sudo command. For example, restart apache server:
$ sudo systemctl restart apache2
You can add an additional user to sudo by typing the following command:
$ sudo adduser {userNameHere} sudo
For example, add a user named pankaj to sudo:
$ sudo adduser pankaj sudo

Configuring NTP using chrony

Chrony provides another implementation of NTP and is designed for systems that are often powered down or disconnected from the network. The main configuration file is /etc/chrony.conf  and parameters are similar to those in the /etc/ntp.conf file. – chronyd is the daemon that runs in user space.– chronyc is a command-line program that provides a command prompt and a number of commands. Examples:tracking: Displays system time informationsources: Displays information about current sources. Installing Chrony Install the chrony package by using the following command: # yum install chrony Use the following commands to start chronyd and to… Read More

Read More

Create a new swap partition on RHEL system

For the purpose of this post, let’s assume that you do not have any swap configured on your system. /dev/sdc is the drive referenced with no partitions. Since we are going to make a single partition filling the disk, note that any data currently on that disk will be lost. Follow the steps given below to add /dev/sdc1 partition as the new swap partition on the system. 1. Use the fdisk command as root to create a swap partition. # fdisk /dev/sdc A new prompt will appear, type ‘p’ to… Read More

Read More

Passwordless Login Using SSH Keygen in 5 Easy Steps

SSH (Secure SHELL) is an open source and most trusted network protocol that is used to login into remote servers for execution of commands and programs. It is also used to transfer files from one computer to another computer over the network using secure copy (SCP) Protocol. In this article we will show you how to setup password-less login on RHEL/CentOS 7.x/6.x/5.x and Fedora using ssh keys to connect to remote Linux servers without entering password. Using Password-less login with SSH keys will increase the trust between two Linux servers for easy file synchronization or transfer. My Setup Environment SSH Client : 192.168.0.12… Read More

Read More