Activate Cloud Shell
Cloud Shell is a virtual machine that is loaded with development tools. It offers a persistent 5GB home directory and runs on the Google Cloud. Cloud Shell provides command-line access to your Google Cloud resources.
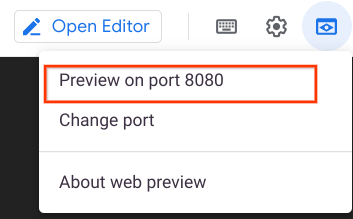
- Click Activate Cloud Shell
at the top of the Google Cloud console.
When you are connected, you are already authenticated, and the project is set to your PROJECT_ID. The output contains a line that declares the PROJECT_ID for this session:Your Cloud Platform project in this session is set to YOUR_PROJECT_ID
gcloud is the command-line tool for Google Cloud. It comes pre-installed on Cloud Shell and supports tab-completion.
- (Optional) You can list the active account name with this command:
gcloud auth list
- Click Authorize.
Task 1. Set project and zone
- Define environment variables for the
project id,regionandzoneyou want to use for the lab.
PROJECT=$(gcloud config get-value project) REGION=us-central1 ZONE=${REGION}-a CLUSTER=gke-load-test TARGET=${PROJECT}.appspot.com gcloud config set compute/region $REGION gcloud config set compute/zone $ZONE
Task 2. Get the sample code and build a Docker image for the application
- Get the source code from the repository by running:
gsutil -m cp -r gs://spls/gsp182/distributed-load-testing-using-kubernetes .
- Move into the directory:
cd distributed-load-testing-using-kubernetes/
- Build docker image and store it in container registry:
gcloud builds submit –tag gcr.io/$PROJECT/locust-tasks:latest docker-image/.
Example Output:ID CREATE_TIME DURATION SOURCE IMAGES STATUS 47f1b8f7-0b81-492c-aa3f-19b2b32e515d xxxxxxx 51S gs://project_id_cloudbuild/source/1554261539.12-a7945015d56748e796c55f17b448e368.tgz gcr.io/project_id/locust-tasks (+1 more) SUCCESS
Task 3. Deploy web application
The sample-webapp folder contains a simple Google App Engine Python application as the “system under test”.
- To deploy the application to your project use the
gcloud app deploycommand:
gcloud app deploy sample-webapp/app.yaml
After running the command, you’ll be prompted with the following.Please choose the region where you want your App Engine application located:
From the list of regions, you can choose us-central, since we selected us-central1 as the region for this project. To choose us-central enter “10” as the input for the prompt.Please enter your numeric choice: 10Note: You will need the URL of the deployed sample web application when deploying the locust-master and locust-worker deployments which is already stored in TARGET variable.
Task 4. Deploy Kubernetes cluster
- Create the Google Kubernetes Engine cluster using the
gcloudcommand shown below:
gcloud container clusters create $CLUSTER \ –zone $ZONE \ –num-nodes=5
Example output:NAME: gke-load-test LOCATION: us-central1-a MASTER_VERSION: 1.11.7-gke.12 MASTER_IP: 34.66.156.246 MACHINE_TYPE: n1-standard-1 NODE_VERSION: 1.11.7-gke.12 NUM_NODES: 5 STATUS: RUNNING
Task 5. Load testing master
The first component of the deployment is the Locust master, which is the entry point for executing the load testing tasks described above. The Locust master is deployed with a single replica because we need only one master.
The configuration for the master deployment specifies several elements, including the ports that need to be exposed by the container (8089 for web interface, 5557 and 5558 for communicating with workers). This information is later used to configure the Locust workers.
The following snippet contains the configuration for the ports:ports: – name: loc-master-web containerPort: 8089 protocol: TCP – name: loc-master-p1 containerPort: 5557 protocol: TCP – name: loc-master-p2 containerPort: 5558 protocol: TCP
Task 6. Deploy locust-master
- Replace
[TARGET_HOST]and[PROJECT_ID]inlocust-master-controller.yamlandlocust-worker-controller.yamlwith the deployed endpoint and project-id respectively.
sed -i -e “s/\[TARGET_HOST\]/$TARGET/g” kubernetes-config/locust-master-controller.yaml sed -i -e “s/\[TARGET_HOST\]/$TARGET/g” kubernetes-config/locust-worker-controller.yaml sed -i -e “s/\[PROJECT_ID\]/$PROJECT/g” kubernetes-config/locust-master-controller.yaml sed -i -e “s/\[PROJECT_ID\]/$PROJECT/g” kubernetes-config/locust-worker-controller.yaml
- Deploy Locust master:
kubectl apply -f kubernetes-config/locust-master-controller.yaml
- To confirm that the
locust-masterpod is created, run the following command:
kubectl get pods -l app=locust-master
- Next, deploy the
locust-master-service:
kubectl apply -f kubernetes-config/locust-master-service.yaml
This step will expose the pod with an internal DNS name (locust-master) and ports 8089, 5557, and 5558. As part of this step, the type: LoadBalancer directive in locust-master-service.yaml will tell Google Kubernetes Engine to create a Compute Engine forwarding-rule from a publicly available IP address to the locust-master pod.
- To view the newly created forwarding-rule, execute the following:
kubectl get svc locust-master
Example output:NAME TYPE CLUSTER-IP EXTERNAL-IP PORT(S) AGE locust-master LoadBalancer 10.59.244.88 35.222.161.198 8089:30865/TCP,5557:30707/TCP,5558:31327/TCP 1m
Task 7. Load testing workers
The next component of the deployment includes the Locust workers, which execute the load testing tasks described above. The Locust workers are deployed by a single deployment that creates multiple pods. The pods are spread out across the Kubernetes cluster. Each pod uses environment variables to control important configuration information such as the hostname of the system under test and the hostname of the Locust master.
After the Locust workers are deployed, you can return to the Locust master web interface and see that the number of slaves corresponds to the number of deployed workers.
The following snippet contains the deployment configuration for the name, labels, and number of replicas:apiVersion: “apps/v1” kind: “Deployment” metadata: name: locust-worker labels: name: locust-worker spec: replicas: 5 selector: matchLabels: app: locust-worker template: metadata: labels: app: locust-worker spec: …
Deploy locust-worker
- Now deploy
locust-worker-controller:
kubectl apply -f kubernetes-config/locust-worker-controller.yaml
- The
locust-worker-controlleris set to deploy 5locust-workerpods. To confirm they were deployed, run the following:
kubectl get pods -l app=locust-worker
Scaling up the number of simulated users will require an increase in the number of Locust worker pods. To increase the number of pods deployed by the deployment, Kubernetes offers the ability to resize deployments without redeploying them.
- The following command scales the pool of Locust worker pods to
20:
kubectl scale deployment/locust-worker –replicas=20
- To confirm that pods have launched and are ready, get the list of
locust-workerpods:
kubectl get pods -l app=locust-worker
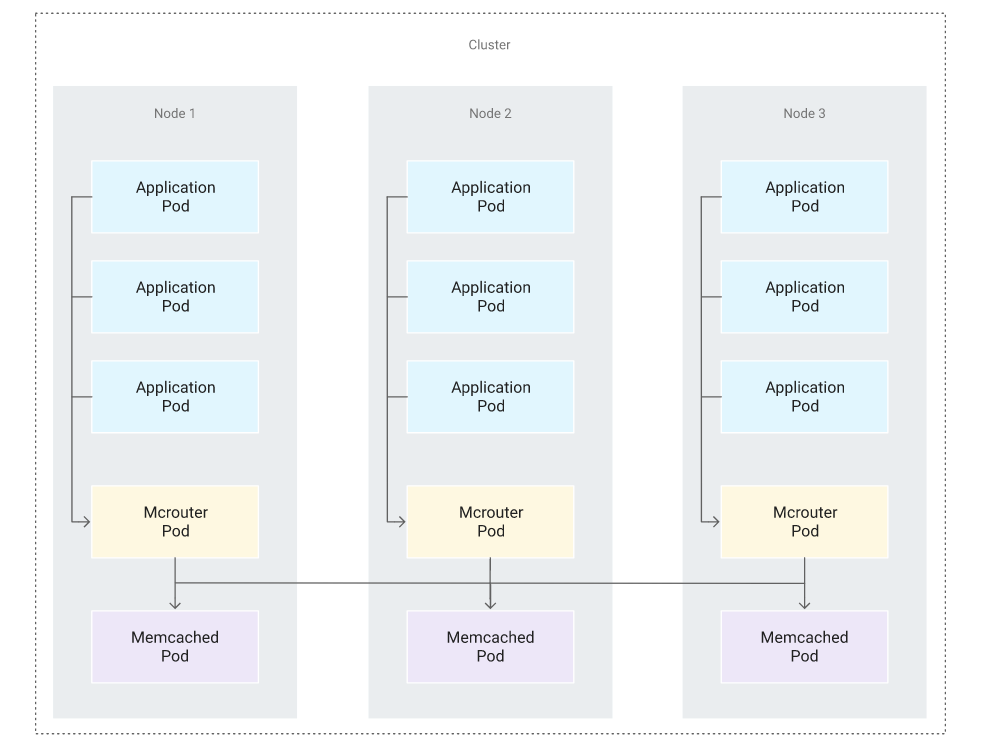
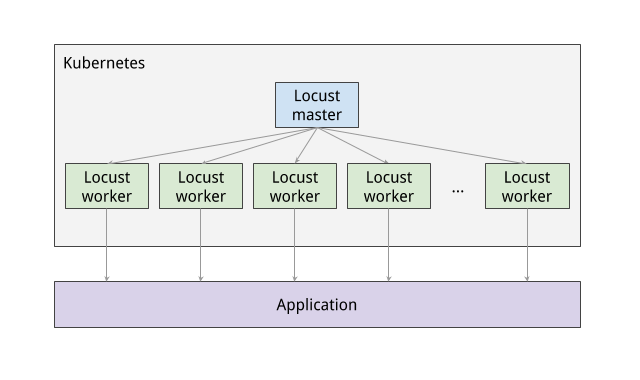
The following diagram shows the relationship between the Locust master and the Locust workers:
Task 8. Execute tests
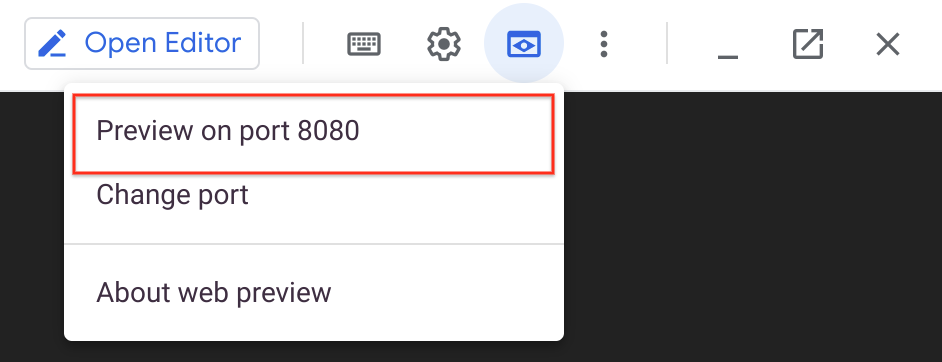
- To execute the Locust tests, get the external IP address by following command:
EXTERNAL_IP=$(kubectl get svc locust-master -o yaml | grep ip: | awk -F”: ” ‘{print $NF}’) echo http://$EXTERNAL_IP:8089
- Click the link and navigate to Locust master web interface.
The Locust master web interface enables you to execute the load testing tasks against the system under test.
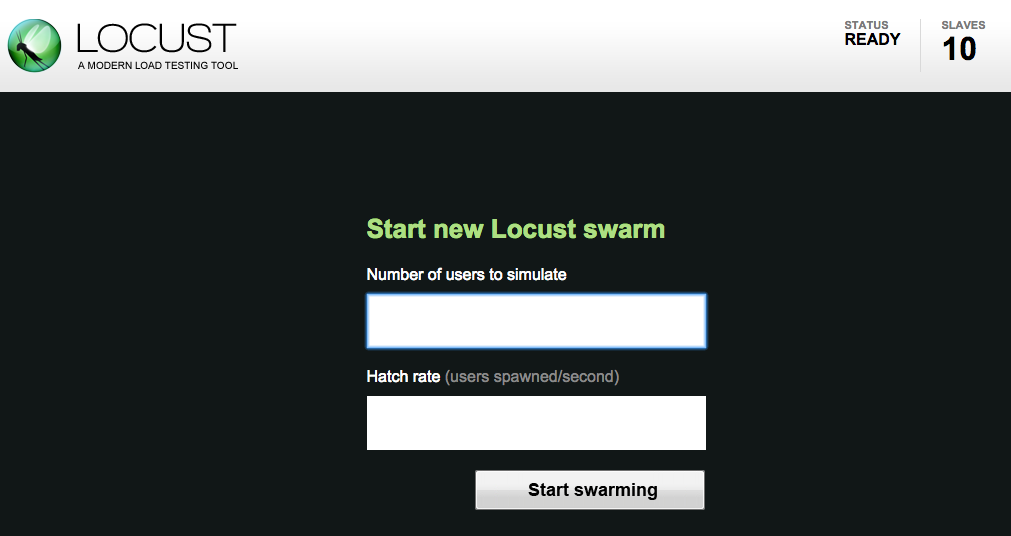
- To begin, specify the total number of users to simulate and a rate at which each user should be spawned.
- Next, click Start swarming to begin the simulation. For example you can specify number of users as 300 and rate as 10.
- Click Start swarming.
As time progresses and users are spawned, statistics aggregate for simulation metrics, such as the number of requests and requests per second.
- To stop the simulation, click Stop and the test will terminate. The complete results can be downloaded into a spreadsheet.